Tornado deaths in the United States have declined dramatically over the past 124 years. When adjusted for population growth in tornado-prone regions, the mortality rate has dropped by 88.8% from the pre-radar era (1900-1950) to the modern era (1991-2024), resulting in an order of magnitude reduced risk of dying and year-to-year volatility as a result of a tornado for people living in regions that have them frequently.
Three Eras of Tornado Safety
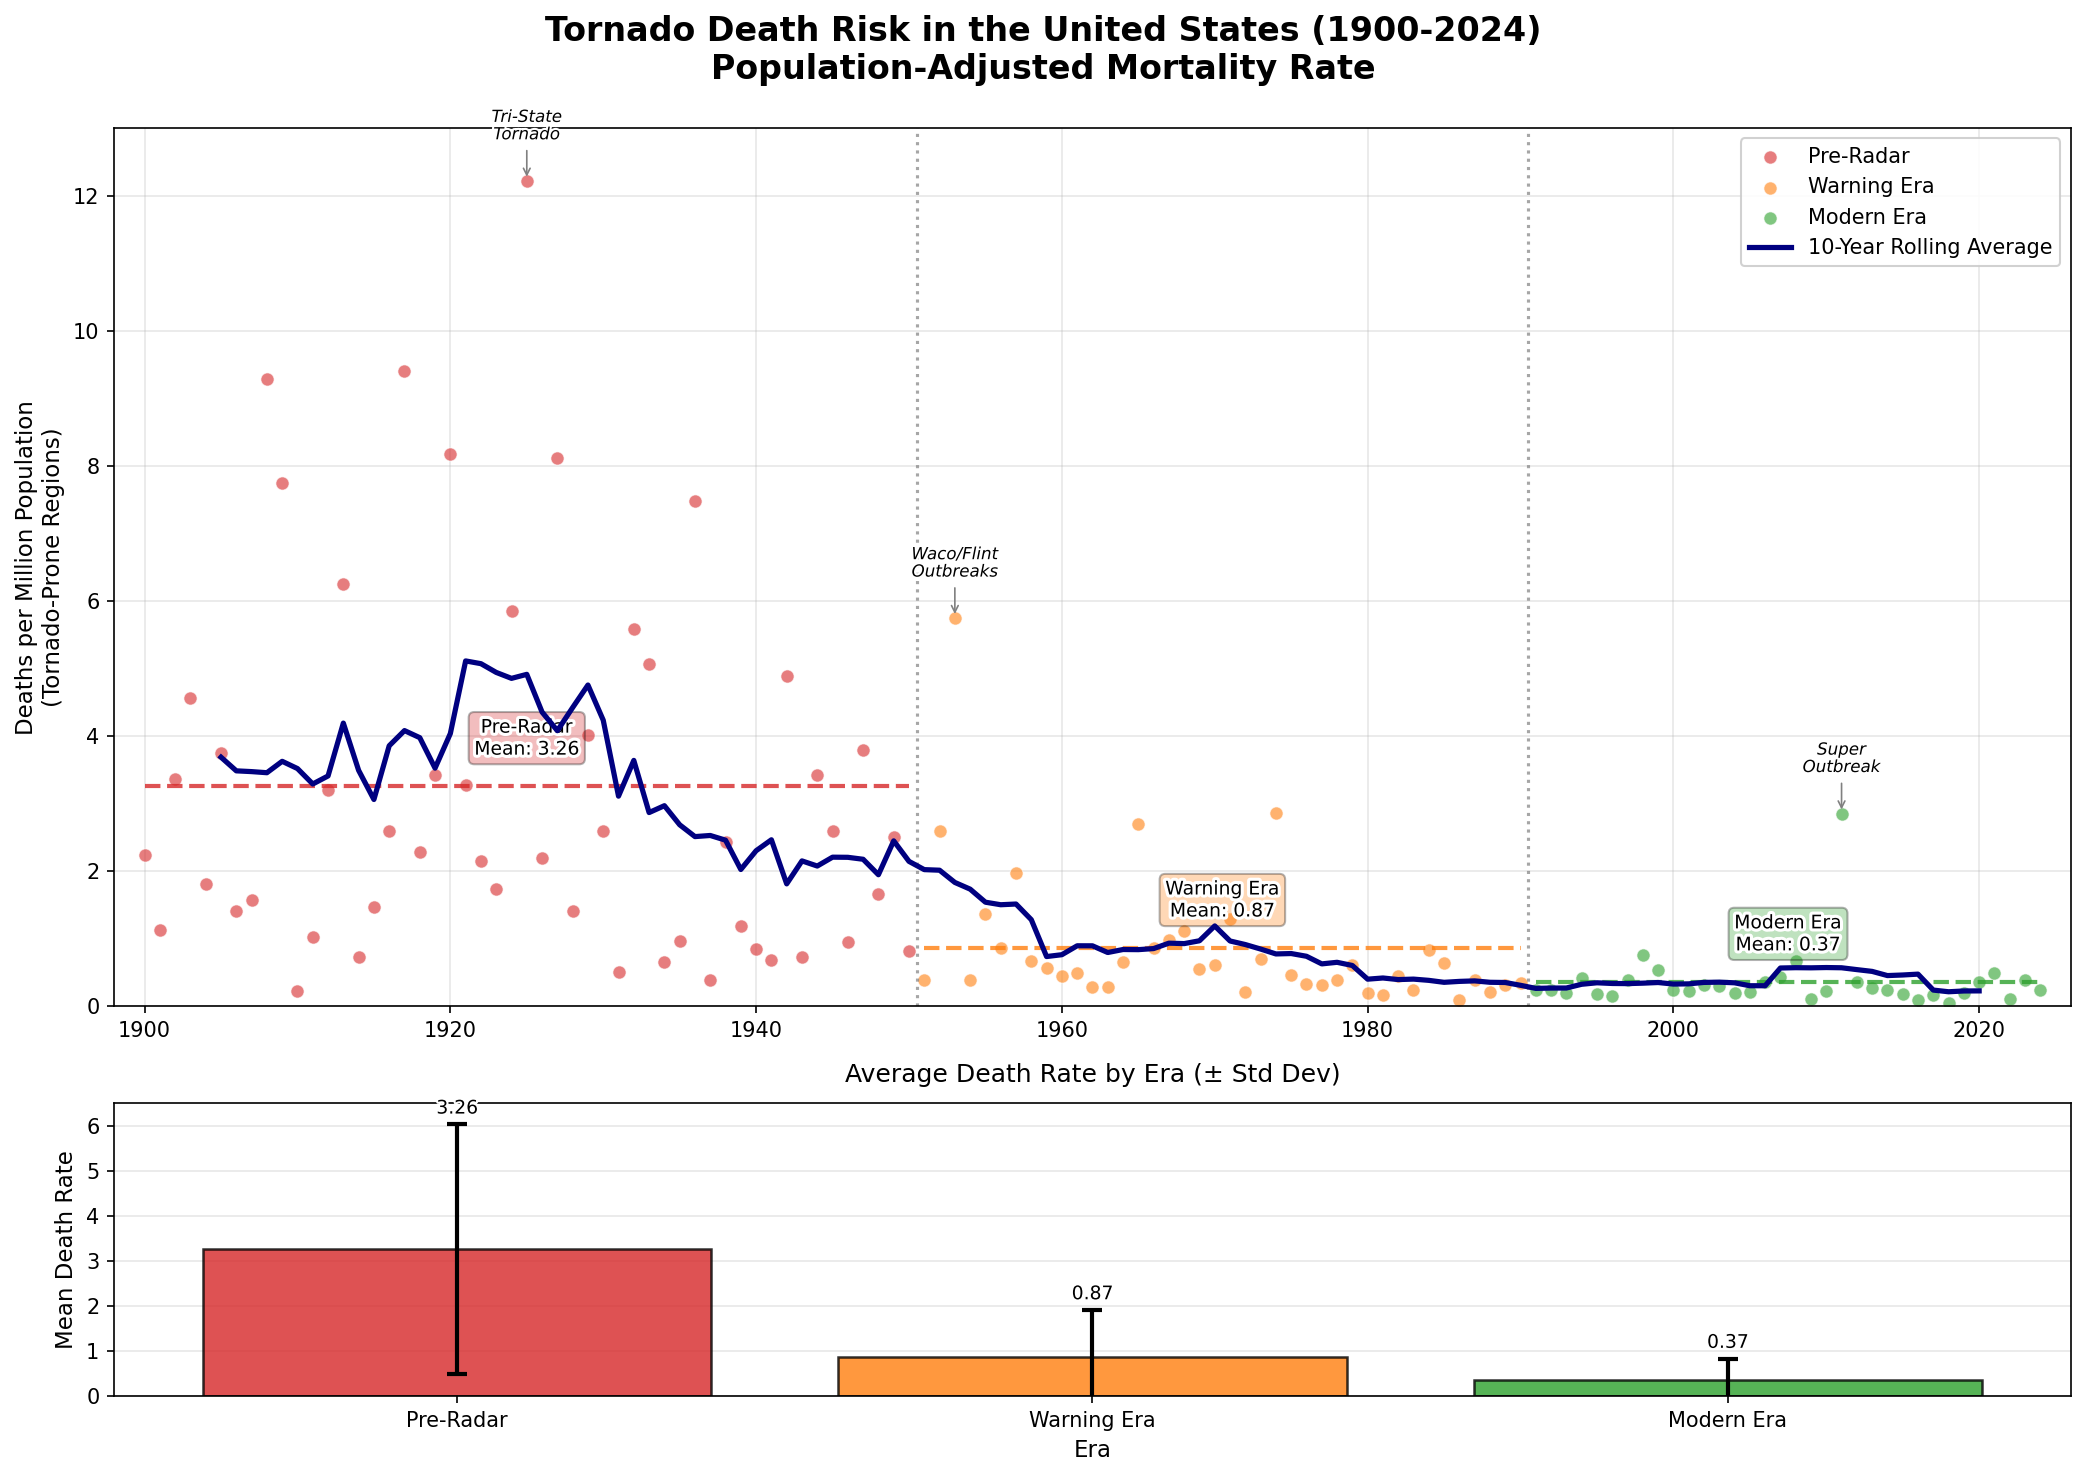
The data reveals three distinct periods in tornado mortality:
Pre-Radar Era (1900-1950)
- Mean death rate: 3.26 deaths per million population (~45-85 million)
- Total deaths: 10,553
- Characteristics: No advance warning systems, high variability in annual deaths
The deadliest single event during this period was the 1925 Tri-State Tornado, which killed 695 people across Missouri, Illinois, and Indiana. Without radar or structured warning systems, communities had no advance notice of approaching tornadoes.
Warning Era (1951-1990)
- Mean death rate: 0.87 deaths per million population (~87-156 million)
- Total deaths: 3,864
- 73% reduction from Pre-Radar era
This era began with the introduction of weather radar in the 1950s. The 1953 Waco and Flint tornado outbreaks marked the last major catastrophic events before warning systems became widespread. The establishment of the National Weather Service's tornado warning program in 1952 represented a turning point in public safety.
Modern Era (1991-2024)
- Mean death rate: 0.37 deaths per million population (~158-210 million)
- Total deaths: 2,332
- 57% reduction from Warning Era, 89% reduction from Pre-Radar era
Advances in Doppler radar, improved forecasting models, and widespread communication through mobile devices have further reduced casualties. The beginning of this era is marked by the deployment of the Nexrad system over the course of 1992 to 1997. The 2011 Super Outbreak remains an outlier, but even this catastrophic event resulted in a lower population-adjusted death rate (2.85 per million) compared to historical standards. In total, this means we're now down to only around 69 deaths each year from tornadoes.
Key Insights
Dramatic Risk Reduction
The 10-year rolling average shows a steady decline from peaks of 5+ deaths per million in the 1920s to consistently below 0.5 in recent decades. This represents one of the most successful public safety improvements in American history.
Declining Variability
Not only has the mean death rate decreased, but the standard deviation has also fallen dramatically:
- Pre-Radar: σ = 2.77
- Warning Era: σ = 1.04
- Modern Era: σ = 0.47
This reduced variability indicates more consistent safety outcomes across different years and events.
Methodology
The analysis uses population-adjusted mortality rates calculated as deaths per million population in tornado-prone regions. Population estimates are derived from U.S. Census data for 25 states with significant tornado activity: Alabama, Arkansas, Florida, Georgia, Iowa, Illinois, Indiana, Kansas, Kentucky, Louisiana, Michigan, Minnesota, Missouri, Mississippi, North Carolina, North Dakota, Nebraska, Ohio, Oklahoma, South Carolina, South Dakota, Tennessee, Texas, Virginia, and Wisconsin. These states were specifically selected because they capture the vast majority of historical US tornado climatology and fatalities, covering both the traditional "Tornado Alley" in the Plains and "Dixie Alley" in the Southeast. By focusing on these regions, the population adjustment better reflects the risk to the communities most exposed to significant tornado hazards.
Population growth in these regions:
- 1900: ~45 million
- 1950: ~85 million
- 1990: ~156 million
- 2024: ~210 million
The era boundaries reflect major technological milestones:
- 1950/1951: Introduction of weather radar and formal tornado warnings
- 1990/1991: Widespread adoption of Doppler radar (WSR-88D network)
Data Sources
- Tornado deaths (1950-2024): NOAA Storm Prediction Center Tornado Database
- Tornado deaths (1900-1949): Thomas P. Grazulis "Significant Tornadoes" historical records
- Primary Institutional Source: National Weather Service (NWS) / Storm Prediction Center (SPC), Norman, OK
- Population estimates: U.S. Census Bureau Historical Population Tables
View Analysis Code, Data & Schema
The complete Python code for this analysis is available in tornado_analysis.py.
The raw data series used to compute the chart is in tornado_data.csv, and the schema is documented in dataset_schema.md.
The pre-computed chart outputs are available as CSVs under the Unlicense:
tornado_results_yearly.csv(Year-by-year values used in the plot)tornado_results_era_stats.csv(Era aggregates used in the bar chart)
Conclusion
Technological innovation in weather forecasting has saved thousands of lives. The dramatic reduction in population-adjusted mortality demonstrates the value of sustained investment in meteorological research, warning systems, and public education. An American in a tornado-prone region today faces 1/10th the risk their great-grandparent did.
The success of tornado safety programs shows that early warning systems work, public communication infrastructure matters, and continuous technological improvement compounds over time to create substantial societal benefits.